What delivery density means for route design
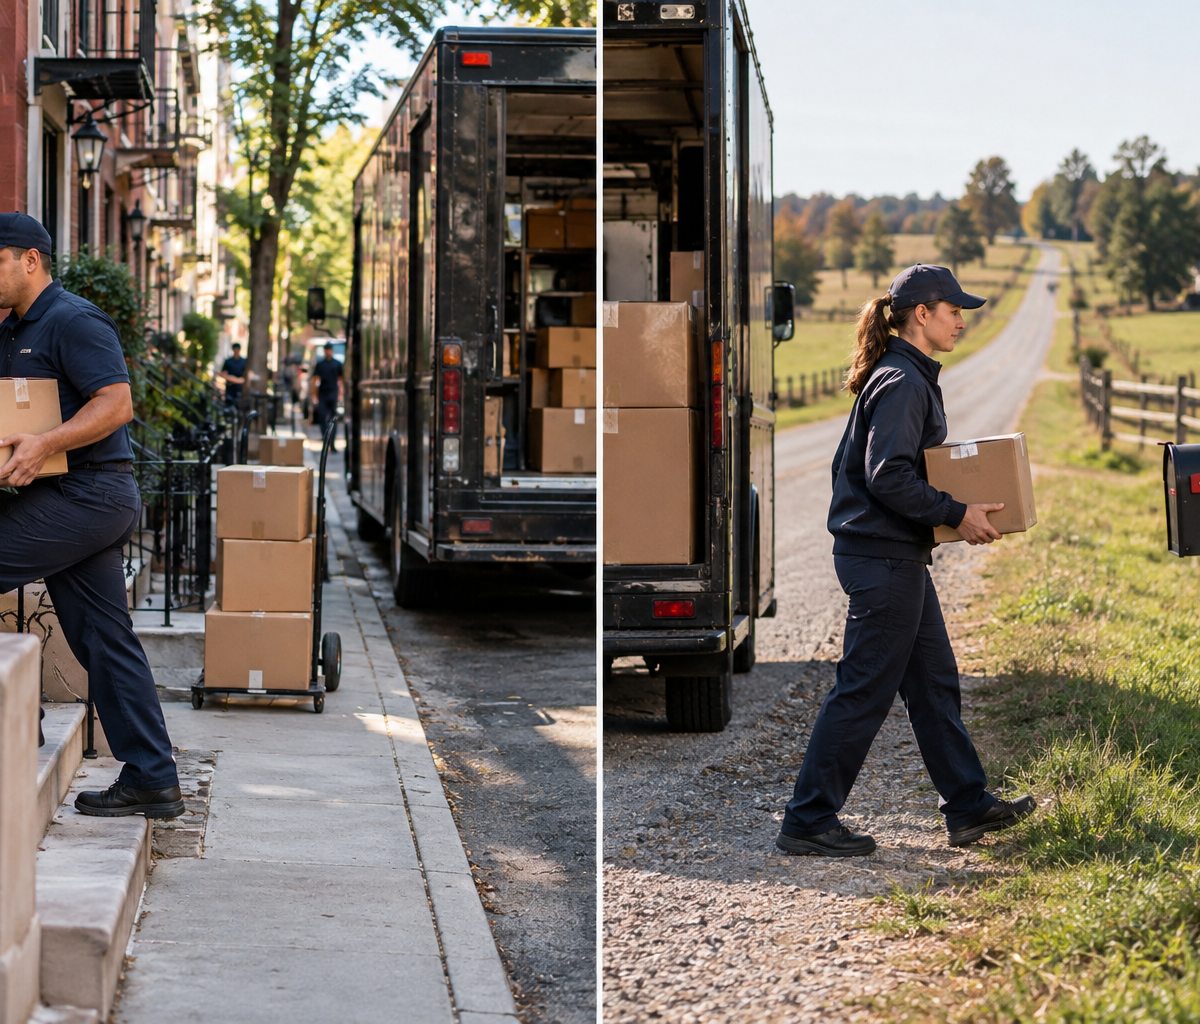
Compare twenty stops in two blocks with twenty stops across rural roads to see how geographic concentration changes route design.
Two routes each have twenty delivery stops. On one, the stops sit within two blocks. On the other, they are spread along rural roads. The stop count is identical, yet the travel between stops is very different. What delivery density means is how closely delivery stops are concentrated in a defined area or along a route. It describes the geography of the work. It does not, by itself, say whether a driver is skilled, slow, or productive.
Density helps a planner compare route shapes and anticipate travel burden. It can also help a job seeker understand why two routes with the same parcel count may feel different. A dense route may involve shorter drives and more parking, walking, or building access. A dispersed route may have fewer addresses per mile and more time behind the wheel. The measure becomes useful only when its denominator and the surrounding conditions are clear.
Choose what stops per mile counts
The numerator may be delivery stops, unique addresses, orders, or parcels. These are not equivalent. Five parcels left at one address create five parcels but one stop. A building with several recipients may count as one vehicle stop and several individual handoffs. A planner should name the unit before comparing routes. Otherwise, a route can appear denser simply because its packages are counted differently.
The denominator also matters. Some teams use stops per route mile, while others look at stops in a square mile or within a service area. Stops per mile describes how often a route encounters a stop along the travel it covers. Stops per square mile describe geographic concentration within an area. Neither number captures every detail. A river crossing, highway access point, or building entrance can make two areas with similar counts behave differently.
Suppose the clustered route has twenty stops along a short loop and the rural route has twenty over a much longer drive. The clustered route has more stops per mile under that simple measure. That statement says nothing about package weight, elevators, signatures, weather, or parking. It is a starting description of route shape, not a complete workload score.
Define the boundary of the measurement as well. Does route mileage include travel from the station to the first stop and the return? Are failed attempts included as stops? Are pickups counted alongside deliveries? A density figure without those rules is hard to compare across teams or dates. It can still be useful internally if the same method is applied consistently and the reader understands what it leaves out.
Clustered stops change the travel pattern
Clustered stops can reduce the travel distance between addresses. In the two-block example, a driver may park once and serve several nearby homes or businesses on foot where that is permitted and practical. The route may have less between-stop driving than the rural route. That can free time for more stops, but only if the access and handoff work are manageable.
High geographic concentration can also create friction. Curb space may be limited, building entry may take time, and several deliveries may require different floors or receiving procedures. A downtown block with twenty addresses is not automatically quicker than a quiet suburban block with twenty driveways. The density measure captures proximity; the route plan must still account for stop service time and local constraints.
Some dense areas allow route consolidation. If many deliveries fall in a small area, a planner can group them into a compact sequence. Other areas may have one-way streets or restricted loading that prevent the shortest-looking path. Density informs the design, but it does not decide the exact stop order. A separate topic owns how a planner or driver chooses that order.
For a job seeker, a dense route may mean more frequent entry and exit from the vehicle, more parcels handled per block, and more interactions with building staff or recipients. A low-density route may mean longer driving intervals. Neither description guarantees a better day. Ask about the actual territory, parking, package mix, and expected service window rather than relying on a "high-volume" label.
Dispersed stops add travel between handoffs
On the rural route, the twenty destinations span many miles. The driver may spend more time reaching the next address than completing the handoff at each stop. Even when every delivery takes only a short time at the door, the route can take most of the shift because of travel. A stop-count target borrowed from a compact city route would ignore this difference.
Geographic dispersion also affects recovery from a failed attempt or an added pickup. Returning to a distant address can be costly in travel time. A late order inserted far from the route's current path can extend the day. A planner should examine the actual map, service windows, and road network rather than conclude that twenty stops are always a light load.
Rural does not automatically mean low density in every measurement. A small town may have a cluster of stops surrounded by long travel from the station. If the measure includes depot-to-first-stop miles, density will look lower than if it counts only miles between customer stops. Both views can answer useful questions, but they answer different ones. The first reflects the whole route's travel; the second isolates spacing within the delivery area.
Road quality and access can matter as much as distance. A route along fast roads can cover more miles in a given period than one with repeated slow intersections. A long private drive can add time without adding a new public-road mile to some mapping methods. The density figure needs to be read with these local facts, not used as a substitute for them.
Route shape is not a driver-performance verdict
Route shape is assigned or constrained by demand geography. A driver does not choose where customers live. Comparing completed stops per hour across a dense route and a dispersed route without accounting for travel can be unfair and misleading. The difference may come from the territory rather than individual effort. The same applies when one route has apartment access and another has easy curbside handoffs.
Performance evidence can still be useful. A manager may compare actual times with a route-specific plan, review a change over several days, or examine a repeated delay at one location. Those analyses require more than density alone. The delivery route performance metrics guide addresses how route results are measured. This article explains the geographic feature that should be considered before interpreting those results.
In the twenty-stop example, it would be easy to praise the driver who finishes the clustered route first and criticize the driver on rural roads. The comparison omits miles, access, service requirements, and start and return travel. A fair review would first ask whether both routes were designed for similar working time and whether unusual events occurred. Density is context for that review, not its conclusion.
A route's density can also change from day to day as customer demand changes. A territory with many deliveries one week may have fewer the next. One driver may run the same geographic area but see a different pattern of stops. Treating density as a permanent property of the worker or route name can obscure the actual day's work.
Use density during route design
A planner can plot the day's stops and look for natural groups. If twenty stops share two blocks, they may form a compact route segment. If another twenty span distant roads, they may need a different time allowance even though the count matches. The planner then checks package volume, vehicle capacity, service windows, driving conditions, and available driver hours. Density informs that plan alongside the other inputs.
Customer density and delivery windows interact. A study published in the Journal of Business Logistics examined both factors in relation to route efficiency. That research supports treating geographic concentration and time constraints as separate planning variables. It does not supply a universal stop target for Delpack or any particular delivery role. A tight delivery window can make a geographically dense set of stops difficult, while a broader window may permit a different sequence.
Density can help a team decide where to draw route boundaries. A planner might keep a dense neighborhood together instead of splitting its nearby stops across several vehicles. In a dispersed region, the planner may group stops by road corridor to avoid repeated long returns. Those are examples of possible design choices, not rules that every operation must follow. Vehicle type, customer commitments, and depot location can change the best arrangement.
At the end of the day, comparing planned and actual travel can test the assumptions behind the route. If a supposedly dense cluster takes longer than expected, the issue may be access time rather than geography. If a rural route repeatedly exceeds its planned hours, the assumed travel speed or service area may be unrealistic. That feedback improves route design without turning a density statistic into a judgment about one person.
Compare the same twenty stops under two plans
Imagine that each set of twenty stops must be completed within the same broad service period. The city set is compact enough for one driver to travel a short distance between most addresses. The rural set requires long drives between some addresses. A planner might allow a different amount of route time for the two sets even before considering parcel sizes. If the city stops include several buildings with slow access, that additional service time must be added. If the rural roads have fast direct connections, the travel estimate should reflect that rather than rely on a label such as "remote."
Now imagine splitting each set between two drivers. Dividing the city blocks poorly could make both drivers travel into the same small area, reducing the advantage of concentration. Dividing the rural stops by a sensible road corridor could avoid a long return trip, although each driver might still cover many miles. The same density value can lead to different route choices depending on boundaries. This is why the measure belongs in a map-based planning discussion instead of standing alone as a target.
Read a density figure carefully
When someone quotes "ten stops per mile," ask what those miles include and what counts as a stop. Are several packages at one address one stop? Does the figure include the trip from the depot? Is it based on planned addresses or completed attempts? Are pickups included? These questions make the number usable. Without them, two teams may use the same phrase for different calculations.
Then ask what the figure leaves out. A route can be geographically dense but have heavy cartons that take more loading time. It can have light parcels but difficult parking. It can contain business deliveries with receiving appointments or residential drops with different access conditions. Density is a spatial measure. The full workload estimate needs these operational details.
A simple map can often explain more than a single score. Mark the twenty city stops and the twenty rural stops, then trace the likely travel needed for each set. The visual pattern immediately shows why equal stop counts do not imply equal miles. Add time windows and package details only after the geographic difference is clear. This sequence keeps the density concept from being buried under a larger performance debate.
What this means for a delivery job
A job posting may promise a fixed route or describe a territory without giving its daily stop pattern. A candidate can ask whether stops are typically close together, how much travel separates clusters, and whether the route includes apartments, rural roads, or business receiving areas. Asking about package count alone will not reveal the driving-versus-handoff mix.
Density may also affect the tools and habits a driver uses. On a compact route, organizing parcels by building or block can matter. On a dispersed route, missing a turn may cost more travel. The employer's actual routing and safety procedures control how the work is done. A candidate should not assume that a dense territory is easier, or that a sparse territory is slower because of the driver.
The Fort Wayne driver careers page lists Delpack's current local opportunities. The posting and interview are the right places to learn the actual territory and route expectations. This article supplies a question to bring to that conversation: how concentrated are the stops, and how does the operation account for that when it plans the day?
Compare geography before comparing counts
What delivery density means is the concentration of stops within a defined distance or area. The twenty stops in two blocks and the twenty stops along rural roads have the same count but very different spacing. A density measure helps describe that spacing if its numerator and denominator are explicit. Route design can use the description; a driver-performance judgment needs a broader view of actual work, conditions, and evidence.
Continue with Delpack
Review the Fort Wayne career overview or contact Delpack with a question about the company.